Land surface drought and fire activity seen by Meteosat
Relationships between the spatial–temporal variability of IR LST retrievals and fire activity
Heat waves and land surface drought are critical factors that contribute to fire risk and probability to fire occurrence and spread. Short-term climatic anomalies (months to years) affect fire probability by modifying vegetation growth and fuel moisture before the fire and by influencing weather during the period of fire spread. The variability of climate and weather patterns over the Mediterranean region highlights the value of having an improved understanding of the relationships between drought and wildfire, and accordingly, of the role of biophysical forcing effect of land surface state to fire danger.
Land Surface Temperature (LST) and its anomalies derived from geostationary MSG satellite observations are used as biophysical indices of drought across the climatic gradient over Eastern Mediterranean region (Bulgaria) and of vulnerability to biomass burning (delineated here into different land cover types). Utility of their use in characterizing fire activity and severity, here derived by LSASAF FRP-Pixel product is illustrated.
Biophysical drivers of fire activity
LSASAF LST product (MLST) based on clear-sky measurements from the MSG system in the thermal infrared window (MSG/SEVIRI channels IR10.8 and IR12.0) every 15 min is used as a biophysical indexes of land surface state. The 12-year time seriesr of LST at 0900 UTC time slot, covering the period June-September (2007-2018) including only days/locations with satellite fire detections for the region of Bulgaria are constructed. On this basis the monthly mean LST anomalies are derived and further used to reveal dry land surface state.
The pattern of fire activity is characterized by evaluation of satellite detections of biomass burning according to the LSASAF FRP-Pixel product that provides information on the location, timing, and fire radiative power (FRP, in MW) output of landscape fires detected every 15 minutes across the full Meteosat disk at the native spatial resolution of the SEVIRI sensor. FRP gives information on the measured radiant heat output of detected fires and is a direct result of the combustion process, whereby carbon-based fuel is oxidized to CO2 with the release of a certain "heat yield“. Fire regime is characterized by the frequency of detections and severity according to the released energy from biomass burning.
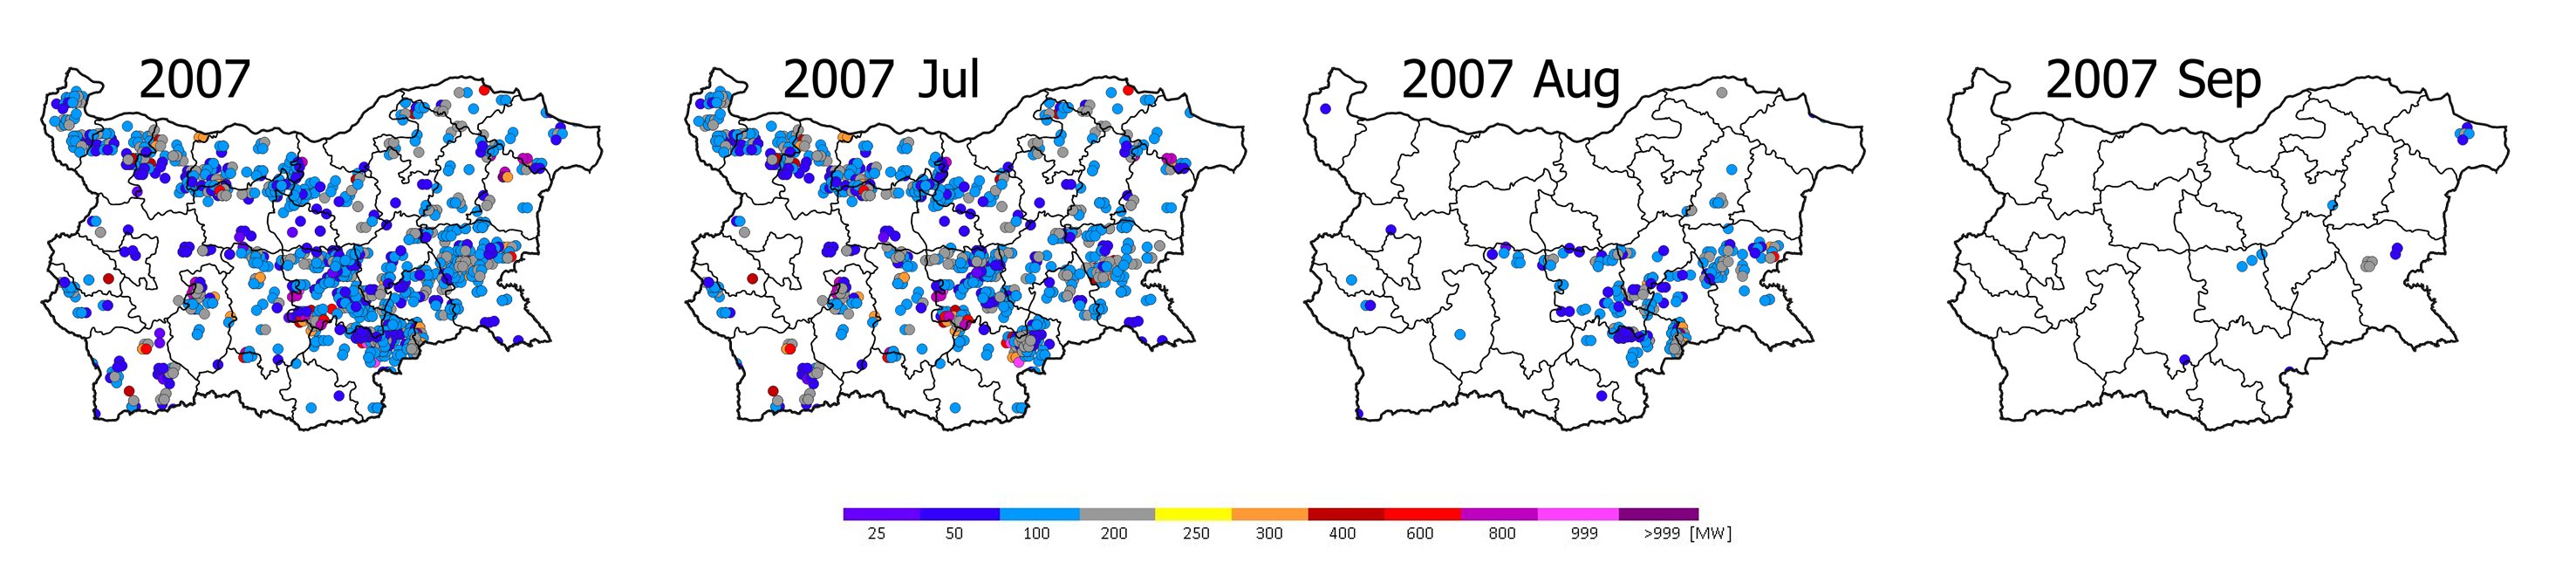
Fig.1: Maps of the spatial–temporal (monthly/annual) distribution of fire activity and color-coded severity of biomass burning according LSASAF FRP-Pixel (MW) product. Example: July-September 2007 over Bulgaria.
Active fire monitoring from space
For analysis of spatial distribution and dynamics of fire activity, maps with accumulated FRP detections for each month of July-September period (and each year for the 2004-2019) over Bulgaria are constructed. Example for 2007 on Fig. 1 illustrates definite seasonal distribution of fire activity which varies significantly during different months, including the fire severity indicated in color scale of released energy (MW) from burning biomass.
There is a repetition of spots with higher fire activity during different months. It is of importance to show how the spatial distribution of extremes in fire activity varies depending on horizontal patterns of the biophysical state characteristics.
Qualitative analyses: Consistency between biophysical indices of land surface state and fire activity
Visual comparison between color-coded maps of the monthly mean LSASAF LST anomalies and the spatial-temporal variability of fire-pixel detections in Fig. 2 depicts their consistency. It is seen that the higher positive LST anomalies (in red colour) correspond to higher number of FRP detected fire pixels, both being maxima in the extreme heat wave period over SE Europe in July 2007. The stronger LST anomalies are related to higher number of fire detections.
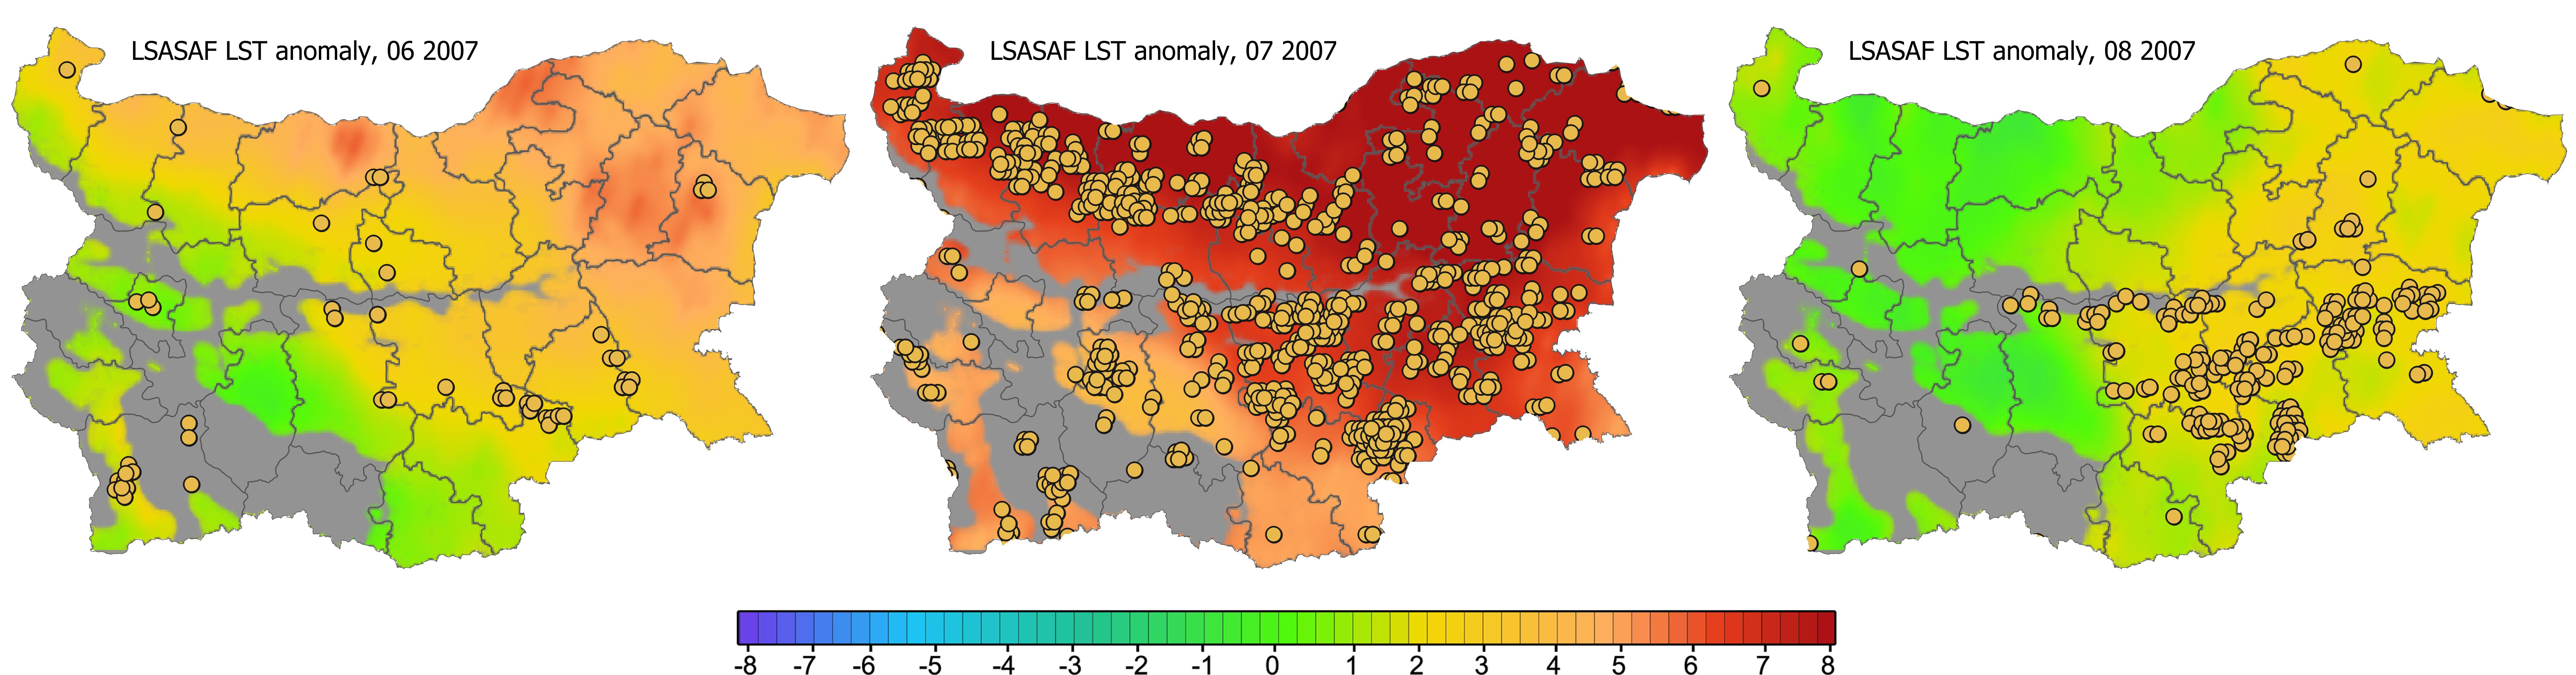
Fig. 2: Spatial distribution of monthly mean LSASAF LST anomalies with LSASAF FRP fire pixel detections overlaid. Example: June-August 2007, region of Bulgaria.
Quantitative analyses: Biophysical forcing effect
Exponential regression models fit the link between LST monthly means, respectively LST anomalies and FRP-fire characteristics (number of detections; released energy FRP, MW) at high correlations. Examples are presented on Fig. 3.
Quantitative exponential models are illustrated for forest, shrubs, cultivated LC types (July, August). A statistically significant high correlation between the wildfire severity and the biophysical drivers based on LSASAF LST retrievals is seen.
Conclusion
Satellite IR retrieval of radiative temperature is a reliable source of information for vegetation dryness and fire occurrence. The LSASAF LST product and related parameters as anomalies are sensitive to evaluate the dynamics of vegetation fires occurrence and severity.
More information in: Stoyanova, J.S.; Georgiev, C.G.; Neytchev, P.N. Satellite Observations of Fire Activity in Relation to Biophysical Forcing Effect of Land Surface Temperature in Mediterranean Climate. Remote Sens. 2022, 14(7), 1747. https://doi.org/10.3390/rs14071747
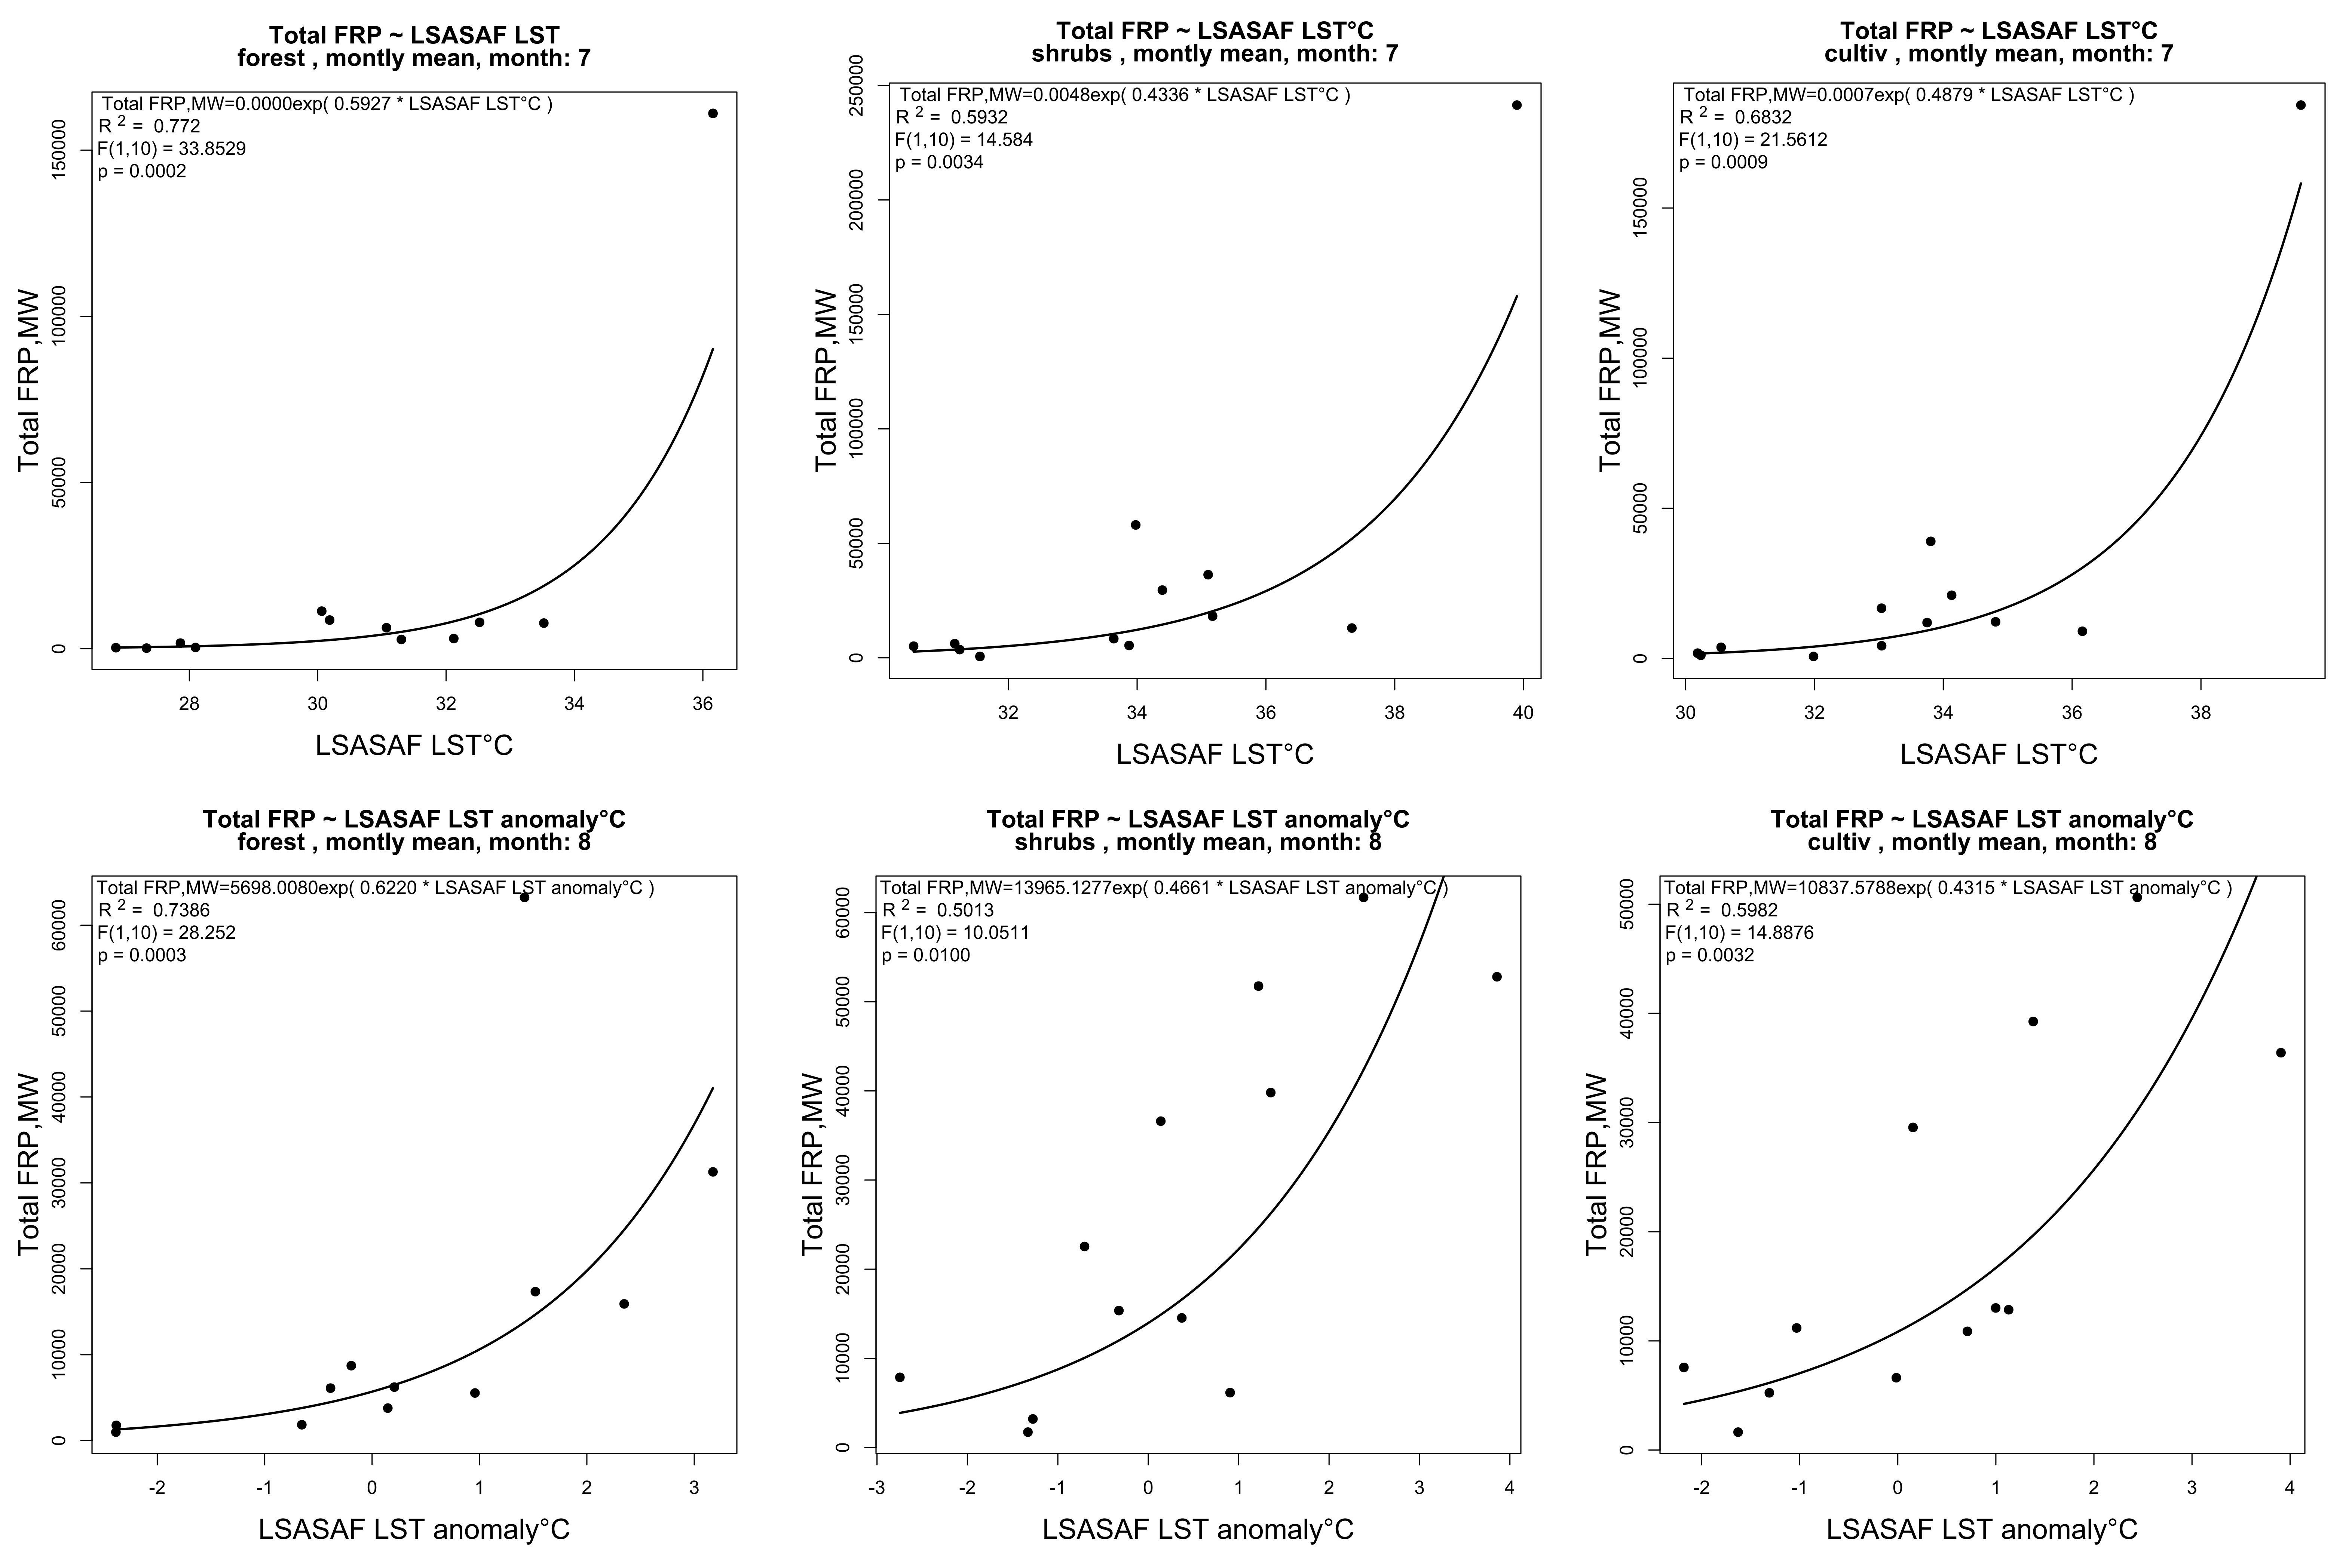
Fig. 3: Regression models of the total energy released by biomass burning, FRP-Pixel product (MW) vs. LSASAF LST 0900 UTC for: (a) forest; (b) shrubs; (c) cultivated, and vs. LSASAF LST anomaly for: (d) forest; (e) shrubs; (f) cultivated.